- Using PVAAS for a Purpose
- Key Concepts
- PEERS
- About PEERS
- Understanding the PEERS pages
- Evaluation List
- Evaluation Summary
- Evaluation Forms
- Add Educator
- Add Evaluator
- Manage Access
- Add a school-level Educator to PEERS
- Add a district-level Educator to PEERS
- Add the Evaluator permission to a user's account
- Remove the Evaluator permission from a district user's account
- Add the Evaluator or Administrative Evaluator permission to a district user's account
- Remove the Administrative Evaluator permission from a district user's account
- Remove an Educator from PEERS
- Restore a removed Educator
- Assign an Educator to a district-level Evaluator
- Assign an Educator to an Evaluator
- Unassign an Educator from an Evaluator
- Assign an Educator to a school
- Unassign an Educator from a school
- Link a PVAAS account to an Educator
- Working with Evaluations
- Switch between Educator and Evaluator
- View an evaluation
- Use filters to display only certain evaluations
- Print the Summary section of an evaluation
- Understanding evaluation statuses
- Determine whether other evaluators have access to an evaluation
- Lock or unlock an evaluation
- Save your changes
- Mark an evaluation as Ready for Conference
- Release one or more evaluations
- Download data from released evaluations to XLSX
- Make changes to an evaluation marked Ready for Conference
- Reports
- School Reports
- LEA/District Reports
- Teacher Reports
- Student Reports
- Comparison Reports
- Human Capital Retention Dashboard
- Roster Verification (RV)
- Getting Started
- All Actions by Role
- All Actions for Teachers
- All Actions for School Administrators or Roster Approvers
- Manage teachers' access to RV
- Assign other school users the Roster Approver permission
- View a teacher's rosters
- Take control of a teacher's rosters
- Add and remove rosters for a teacher
- Copy a roster
- Apply a percentage of instructional time to every student on a roster
- Batch print overclaimed and underclaimed students
- Remove students from a roster
- Add a student to a roster
- Return a teacher's rosters to the teacher
- Approve a teacher's rosters
- Submit your school's rosters to the district
- All Actions for district admin or district roster approvers
- Assign other LEA/district users the Roster Approver permission
- Take control of a school's rosters
- View a teacher's rosters
- View the history of a teacher's rosters
- Edit a teacher's rosters
- Add and remove rosters for a teacher
- Copy a roster
- Apply a percentage of instructional time to every student on a roster
- Batch print overclaimed and underclaimed students
- Return a school's rosters to the school
- Approve rosters that you have verified
- Submit your district's rosters
- Understanding the RV Pages
- Viewing the History of Actions on Rosters
- Additional Resources
- Admin Help
- General Help
Teacher Value-Added
Understanding the Report

Growth Index
The growth index is a reliable measure of whether students exceeded, met, or fell short of the growth standard. This value takes into account the amount of growth the students made as well as the amount of evidence above or below the growth standard. Specifically, the growth index is the growth measure divided by its standard error.
The growth index is plotted as a color-coded diamond in the growth index graph at the top of the report.
Growth Color Indicators
Each growth index is color-coded to indicate how strong the evidence is that the students exceeded, met, or fell short of the growth standard.
The key at the bottom of the report provides guidance for interpreting the colors.
| Growth Color Indicator | Growth Index Compared to the Growth Standard | Interpretation |
|---|---|---|
| Well Above | At least 2 standard errors above | Significant evidence that the teacher's group of students exceeded the growth standard |
| Above | Between 1 and 2 standard errors above | Moderate evidence that the teacher's group of students exceeded the growth standard |
| Meets | Between 1 standard error above and 1 standard error below | Evidence that the teacher's group of students met the growth standard |
| Below | Between 1 and 2 standard errors below | Moderate evidence that the teacher's group of students did not meet the growth standard |
| Well Below | More than 2 standard errors below | Significant evidence that the teacher's group of students did not meet the growth standard |
Growth Measure
Each growth measure is a conservative estimate of the academic growth the students made, on average, in a grade and subject or Keystone content area. The growth measure is based on students that were linked to the teacher and the percentage of instruction. Because the growth measures are estimates, consider their associated standard errors as you interpret the values.
The growth measure is calculated differently for assessments analyzed with the growth standard methodology than it is for PSSA Science and Keystone assessments.
Standard Error
All growth measures on the PVAAS reports are estimates. All estimates have some amount of measurement error, which is known as the standard error. This value defines a confidence band around the growth measure, which describes how strong the evidence is that the group of students exceeded, met, or fell short of the growth standard.
For more information about standard errors, see Growth Measures and Standard Errors.
Growth Standard
The growth standard represents the point at which the students' scores, on average, align with expectations.
The growth standard signifies the minimum amount of academic growth that educators should expect a group of students to make in a subject and grade or Keystone content area. In general, this signifies appropriate, expected academic growth. Simply put, the expectation is that regardless of their entering achievement level, students served by each LEA/district, school, or teacher should at least make enough progress to maintain their achievement level relative to their peers. This is a reasonable target for educators who serve all types of students. The growth standard is represented by a vertical green line in the graph.

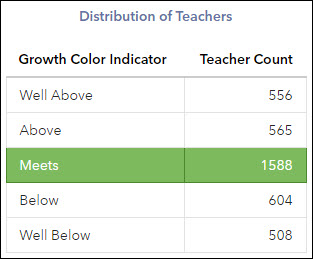
Distribution of Teachers
This distribution lists the number of teachers in each growth color indicator in the selected grade and subject or course in the reference group. This enables each teacher to compare their teacher value-added results with other teachers in the reference group for the same state-assessed grade and subject or Keystone content area. It's important to understand that PVAAS does not fit teachers into a predetermined distribution. The number of teachers who appear in each growth color indicator is determined by the amount of statistical evidence that each teacher's group of students exceeded, met, or fell short of the growth standard. The methodology does not predetermine the number or percentage of teachers whose values fall into each growth color indicator range. In fact, the relative size of each growth color indicator group varies by grade and subject or Keystone content area, depending on the evidence of measurable differences in growth. |
|
The use of Normal Curve Equivalents (NCEs) for assessments analyzed with the growth standard methodology should not be confused with the question of whether PVAAS fits LEAs/districts, schools, or teachers into a specific distribution. PVAAS converts scale scores for these assessments into state NCEs before analyzing the data. This conversion provides a common, equal-interval scale for measuring the growth of groups of students, but it does not predetermine the distribution of LEAs/districts, schools, or teachers.
Student List
To see the list of students linked to the teacher in the data, click the Student List button above the chart.
The Used in the Analysis column indicates whether each student was used in the analysis that generated the teacher's value-added report. The most common reasons that students are excluded from the analysis are:
- They don't have assessment scores
- They aren't linked to a teacher
- They don't meet membership or attendance rules
- Their scores are outliers
- They are new to the state or reference group
- They don't have enough prior assessment data
Some of these exclusion rules might not apply to all subjects. Statistical Models and Business Rules describes various conditions that can cause a student to be excluded from the analysis.
Teachers who have a Teacher Value-Added report in the selected subject, grade, or Keystone content area in the most recent year have access to this report.
Showing the Growth Index or Growth Measure
The report displays the growth index graph by default. You can choose the growth measure graph from the menu below the graph. For more information about the growth measure graph, see Interpreting the Data.