- Using PVAAS for a Purpose
- Key Concepts
- PEERS
- About PEERS
- Understanding the PEERS pages
- Evaluation List
- Evaluation Summary
- Evaluation Forms
- Add Educator
- Add Evaluator
- Manage Access
- Add a school-level Educator to PEERS
- Add a district-level Educator to PEERS
- Add the Evaluator permission to a user's account
- Remove the Evaluator permission from a district user's account
- Add the Evaluator or Administrative Evaluator permission to a district user's account
- Remove the Administrative Evaluator permission from a district user's account
- Remove an Educator from PEERS
- Restore a removed Educator
- Assign an Educator to a district-level Evaluator
- Assign an Educator to an Evaluator
- Unassign an Educator from an Evaluator
- Assign an Educator to a school
- Unassign an Educator from a school
- Link a PVAAS account to an Educator
- Working with Evaluations
- Switch between Educator and Evaluator
- View an evaluation
- Use filters to display only certain evaluations
- Print the Summary section of an evaluation
- Understanding evaluation statuses
- Determine whether other evaluators have access to an evaluation
- Lock or unlock an evaluation
- Save your changes
- Mark an evaluation as Ready for Conference
- Release one or more evaluations
- Download data from released evaluations to XLSX
- Make changes to an evaluation marked Ready for Conference
- Reports
- School Reports
- LEA/District Reports
- Teacher Reports
- Student Reports
- Comparison Reports
- Human Capital Retention Dashboard
- Roster Verification (RV)
- Getting Started
- All Actions by Role
- All Actions for Teachers
- All Actions for School Administrators or Roster Approvers
- Manage teachers' access to RV
- Assign other school users the Roster Approver permission
- View a teacher's rosters
- Take control of a teacher's rosters
- Add and remove rosters for a teacher
- Copy a roster
- Apply a percentage of instructional time to every student on a roster
- Batch print overclaimed and underclaimed students
- Remove students from a roster
- Add a student to a roster
- Return a teacher's rosters to the teacher
- Approve a teacher's rosters
- Submit your school's rosters to the district
- All Actions for district admin or district roster approvers
- Assign other LEA/district users the Roster Approver permission
- Take control of a school's rosters
- View a teacher's rosters
- View the history of a teacher's rosters
- Edit a teacher's rosters
- Add and remove rosters for a teacher
- Copy a roster
- Apply a percentage of instructional time to every student on a roster
- Batch print overclaimed and underclaimed students
- Return a school's rosters to the school
- Approve rosters that you have verified
- Submit your district's rosters
- Understanding the RV Pages
- Viewing the History of Actions on Rosters
- Additional Resources
- Admin Help
- General Help
| District Projection Summary | 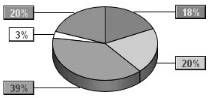 |
Understanding the Report
The data in this report varies based on the type of projection you selected.
Students are grouped based on probability ranges for the selected projection. The first rows of the table display the numbers and percentages of students whose probabilities of reaching the selected performance levels fall into specified ranges. Each row is represented by a slice in the pie graph.
Numbers are not rounded when calculating probabilities. However, for display purposes they are rounded in the table. Students are placed into groups using non-rounded numbers. Therefore, it is possible that two students with the same number on-screen could be in two different groups due to rounding.
Users with access to student data can click on the values in the Student Count column or the corresponding pie slice to see the list of students in that group. You can compare the data in that list with national statistics to evaluate each students' college readiness. PVAAS provides probabilities of success for multiple benchmarks. To find more information about benchmarks used for college admissions follow these steps:
- Open the College Navigator page in the Integrated Postsecondary Education Data System.
- Enter information about the college and click Show Results.
- In the results click the name of a college.
- Expand the Admissions section to find the test scores for the school's recently enrolled students.
Color Coding
| Color Indicator | Probability of Reaching the Selected Performance Level | Interpretation | Recommendation |
|---|---|---|---|
Green | Greater than or equal to 70% | Students are likely to reach at least the selected performance level or benchmark | Continue with students' current academic programs, investigate what has worked – students are on a path to reaching or exceeding the selected performance level or benchmark |
Yellow | Between 40% and 70% | Students may or may not reach at least the selected performance level or benchmark | Investigate and implement adjustments to students' academic programs to increase their likelihood of reaching or exceeding the selected performance level or benchmark |
Light Red | Less than or equal to 40% | Students are not likely to reach the selected performance level or benchmark | Investigate and implement significant changes to students' academic programs to increase their likelihood of reaching the selected performance level or benchmark |
For non-college-readiness projections, two additional rows list the numbers and percentages of students who do not have projections for the selected assessment.
| Color Indicator | Group of Students | Explanation |
|---|---|---|
White | Students without a projection | These students appear in the report but do not have sufficient data in their testing histories to have projections for the selected assessment. For most assessments, students must have a minimum of three prior scores across grades and subjects to have projections. An exception to this rule is made for projections to fourth-grade assessments, which only require two prior scores. |
Orange | Students at or above proficiency | These students passed the selected assessment with a score of Proficient or above. This slice only appears for Keystone assessments. |
Filtering by Student Group
By default, the report includes all the LEA/district's students in the selected grade and subject, Keystone content area, or college readiness test who had sufficient data. Use the Add Student Groups filter to view the report for a subset of students. The list of filters is based on the demographic data in the state assessment files.
To filter the list of students included in the report, click Select Student Groups above the table. In the Student Groups window, you can choose any combination of race, sex, and demographic groups.
If you choose more than one group within a category, the report includes students who are in either group. For example, if you choose Black and Hispanic, the report includes both Black students and Hispanic students.
If you choose multiple groups across categories, the report includes only students who are in the selected groups in all categories. For example, if you choose Male and IEP, the report includes only males who are identified as receiving special education services.
When you are finished making selections, click Submit. The report includes only those groups of students you selected.
To remove the filters, click Clear Student Groups above the table. The report now includes all students in the selected grade.
More Information
What Educators Should Know about PVAAS Student Probabilities
Diagnostic and Projection Summary Reports: Using Together for Decision Making