- Using PVAAS for a Purpose
- Key Concepts
- PEERS
- About PEERS
- Understanding the PEERS pages
- Evaluation List
- Evaluation Summary
- Evaluation Forms
- Add Educator
- Add Evaluator
- Manage Access
- Add a school-level Educator to PEERS
- Add a district-level Educator to PEERS
- Add the Evaluator permission to a user's account
- Remove the Evaluator permission from a district user's account
- Add the Evaluator or Administrative Evaluator permission to a district user's account
- Remove the Administrative Evaluator permission from a district user's account
- Remove an Educator from PEERS
- Restore a removed Educator
- Assign an Educator to a district-level Evaluator
- Assign an Educator to an Evaluator
- Unassign an Educator from an Evaluator
- Assign an Educator to a school
- Unassign an Educator from a school
- Link a PVAAS account to an Educator
- Working with Evaluations
- Switch between Educator and Evaluator
- View an evaluation
- Use filters to display only certain evaluations
- Print the Summary section of an evaluation
- Understanding evaluation statuses
- Determine whether other evaluators have access to an evaluation
- Lock or unlock an evaluation
- Save your changes
- Mark an evaluation as Ready for Conference
- Release one or more evaluations
- Download data from released evaluations to XLSX
- Make changes to an evaluation marked Ready for Conference
- Reports
- School Reports
- LEA/District Reports
- Teacher Reports
- Student Reports
- Comparison Reports
- Human Capital Retention Dashboard
- Roster Verification (RV)
- Getting Started
- All Actions by Role
- All Actions for Teachers
- All Actions for School Administrators or Roster Approvers
- Manage teachers' access to RV
- Assign other school users the Roster Approver permission
- View a teacher's rosters
- Take control of a teacher's rosters
- Add and remove rosters for a teacher
- Copy a roster
- Apply a percentage of instructional time to every student on a roster
- Batch print overclaimed and underclaimed students
- Remove students from a roster
- Add a student to a roster
- Return a teacher's rosters to the teacher
- Approve a teacher's rosters
- Submit your school's rosters to the district
- All Actions for district admin or district roster approvers
- Assign other LEA/district users the Roster Approver permission
- Take control of a school's rosters
- View a teacher's rosters
- View the history of a teacher's rosters
- Edit a teacher's rosters
- Add and remove rosters for a teacher
- Copy a roster
- Apply a percentage of instructional time to every student on a roster
- Batch print overclaimed and underclaimed students
- Return a school's rosters to the school
- Approve rosters that you have verified
- Submit your district's rosters
- Understanding the RV Pages
- Viewing the History of Actions on Rosters
- Additional Resources
- Admin Help
- General Help
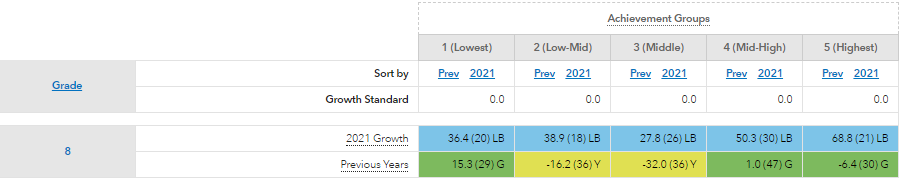 |
Understanding the Report
For PSSA, all grades with data for the selected subject are listed in the table. For Keystone, all content areas are listed in the table. For each grade or Keystone content area, the table displays growth values for each achievement group from the School reports. Values are displayed for the most recent year and for previous years, when available. In each cell in the table, the first value is the growth value. The value in parentheses is the number of students in that achievement group.
The table is color-coded based on whether the data suggests the group of students exceeded, met, or fell short of the growth standard, on average.
Color Indicator | Growth Measure Compared to the Growth Standard | Interpretation |
|---|---|---|
Light Blue | At least one standard error above | Moderate evidence that the group exceeded the growth standard. |
Green | Between one standard error above and one standard error below | Evidence that the group met the growth standard. |
Yellow | More than one standard error below | Moderate evidence that the group did not meet the growth standard. |
White | N/A | The group did not have enough students to generate a growth measure. |
For more information about achievement groups, growth values, and colors, see the Help for School Diagnostic.
By default, the data is organized by grade for PSSA and by content area for Keystone. You can sort the data by the growth value for any group. To sort by the growth values for the most recent year, click the year link for the group you're interested in. To sort by the growth values for previous years, click the Prev link for the group you're interested in.
To view the data for a different test or subject, choose from the Tests/Subjects tab in the blue menu bar at the top of the report.
To view the data for a different school, choose from the Schools tab in the blue menu bar at the top of the report.
To view the School report for any grade or Keystone content area, click on the appropriate link in the table.
Filtering by Student Group
By default, the report includes all the School's students in the selected grade and subject, Keystone content area, or college readiness test who had sufficient data. Use the Add Student Groups filter to view the report for a subset of students. The list of filters is based on the demographic data in the state assessment files.
To filter the list of students included in the report, click Select Student Groups above the table. In the Student Groups window, you can choose any combination of race, sex, and demographic groups.
If you choose more than one group within a category, the report includes students who are in either group. For example, if you choose Black and Hispanic, the report includes both Black students and Hispanic students.
If you choose multiple groups across categories, the report includes only students who are in the selected groups in all categories. For example, if you choose Male and IEP, the report includes only males who are identified as receiving special education services.
When you are finished making selections, click Submit. The report includes only those groups of students you selected.
Even when viewing a filtered group of students, placement of students into the achievement groups is still based on students' relative achievement to students in the reference group in the selected grade and subject or Keystone content area.