- Using PVAAS for a Purpose
- Key Concepts
- PEERS
- About PEERS
- Understanding the PEERS pages
- Evaluation List
- Evaluation Summary
- Evaluation Forms
- Add Educator
- Add Evaluator
- Manage Access
- Add a school-level Educator to PEERS
- Add a district-level Educator to PEERS
- Add the Evaluator permission to a user's account
- Remove the Evaluator permission from a district user's account
- Add the Evaluator or Administrative Evaluator permission to a district user's account
- Remove the Administrative Evaluator permission from a district user's account
- Remove an Educator from PEERS
- Restore a removed Educator
- Assign an Educator to a district-level Evaluator
- Assign an Educator to an Evaluator
- Unassign an Educator from an Evaluator
- Assign an Educator to a school
- Unassign an Educator from a school
- Link a PVAAS account to an Educator
- Working with Evaluations
- Switch between Educator and Evaluator
- View an evaluation
- Use filters to display only certain evaluations
- Print the Summary section of an evaluation
- Understanding evaluation statuses
- Determine whether other evaluators have access to an evaluation
- Lock or unlock an evaluation
- Save your changes
- Mark an evaluation as Ready for Conference
- Release one or more evaluations
- Download data from released evaluations to XLSX
- Make changes to an evaluation marked Ready for Conference
- Reports
- School Reports
- LEA/District Reports
- Teacher Reports
- Comparison Reports
- Human Capital Retention Dashboard
- Roster Verification (RV)
- Getting Started
- All Actions by Role
- All Actions for Teachers
- All Actions for School Administrators or Roster Approvers
- Manage teachers' access to RV
- Assign other school users the Roster Approver permission
- View a teacher's rosters
- Take control of a teacher's rosters
- Add and remove rosters for a teacher
- Copy a roster
- Apply a percentage of instructional time to every student on a roster
- Batch print overclaimed and underclaimed students
- Remove students from a roster
- Add a student to a roster
- Return a teacher's rosters to the teacher
- Approve a teacher's rosters
- Submit your school's rosters to the district
- All Actions for district admin or district roster approvers
- Assign other LEA/district users the Roster Approver permission
- Take control of a school's rosters
- View a teacher's rosters
- View the history of a teacher's rosters
- Edit a teacher's rosters
- Add and remove rosters for a teacher
- Copy a roster
- Apply a percentage of instructional time to every student on a roster
- Batch print overclaimed and underclaimed students
- Return a school's rosters to the school
- Approve rosters that you have verified
- Submit your district's rosters
- Understanding the RV Pages
- Viewing the History of Actions on Rosters
- Additional Resources
- Admin Help
- General Help
| Student Projection Report | 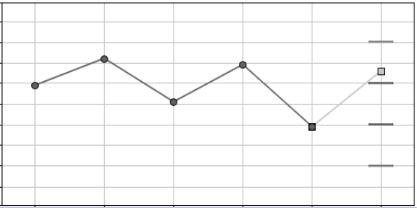 |
The Student Projection report displays information about a student's likely performance on future assessments. The projections are based on each student's individual testing history across grades and subjects, and they represent how the student is likely to perform if the student makes average growth between now and the time the next assessment is administered.
Understanding the Graph
The data in the graph is expressed in state or reference group percentiles.
The red circles represent the student's performance on prior assessments in the selected subject. Although the report displays the student's prior scores in only the selected subject, the student's prior scores across tested subjects are used to generate the projection.
The yellow square represents the student's projected score. This point indicates how the student is likely to perform on the selected assessment if the student makes average growth in this subject.
The colored hash marks represent meaningful scores on the selected assessment. For state assessments, these lines mark the minimum score for each of the state's performance levels. For ACT, PSAT, and SAT, these lines represent meaningful benchmarks. No chart is provided for projections to AP exams.
To see the state or reference group percentile for each mark, place your cursor over the hash mark.
| Subject | Benchmark |
|---|---|
Math | 22 |
Reading | 22 |
English | 18 |
Science | 23 |
The PSAT benchmarks are provided by the College Board. Students who reach these college benchmark scores in the grade indicated should be considered on track to be college ready.
| Subject | Grade | Benchmark |
|---|---|---|
PSAT 8/9 Math | 9 | 450 |
PSAT 8/9 Evidence-Based Reading and Writing | 9 | 410 |
PSAT NMSQT Evidence-Based Reading and Writing | 9 | 460 |
PSAT NMSQT Mathematics | 9 | 510 |
For AP exams, the reports display the student's probability of scoring at least a 3 or higher, 4 or higher, or 5. For ACT, PSAT, and SAT, the reports display the student's probability of reaching meaningful benchmark scores for each subject.
| Subject | Benchmark |
|---|---|
Math | 530 |
Evidence-Based Reading and Writing | 480 |
Understanding the Tables
The first table below the chart displays the student's projection data.
The cell on the left displays the student's projected state or reference group percentile. This value represents how the student is likely to score relative to the state or reference group distribution if the student makes average growth from now until the next assessment is administered. The projected percentile in this cell of the table is represented by the yellow square in the graph.
The rest of the cells in the table list the student's probability of reaching each assessment milestone noted. For state assessments, these cells indicate the student's likelihood of reaching at least Basic, Proficient, or Advanced on the selected assessment. For AP exams, the cells indicate the student's likelihood of scoring at least a 3 or higher, 4 or higher, or 5. For ACT, PSAT, and SAT, the cells indicate the student's likelihood of reaching meaningful benchmark scores.
The second table lists the student's testing history in the selected subject. In the State NCE\Score column, prior scores for assessments analyzed with the growth standard methodology are listed as reference group NCEs. In the Scale Score column prior scores for assessments analyzed with the predictive methodology are listed as state or reference group scale scores. In the %-ile column, scores for all assessments are listed as state or reference group percentiles.
Performance Levels and Benchmarks
You can compare the data in this report with national statistics to evaluate each students' college readiness. PVAAS provides probabilities of success for multiple benchmarks. To find more information about benchmarks used for college admissions follow these steps:
- Open the College Navigator page in the Integrated Postsecondary Education Data System.
- Enter information about the college and click Show Results.
- In the results click the name of a college.
- Expand the Admissions section to find the test scores for the school's recently enrolled students.
In What are the ACT® College Readiness Benchmarks, ACT, Inc. provides information about benchmarks for math, reading, English, and science.
The PSAT benchmarks are provided by the College Board. Students who reach these college benchmark scores in the grade indicated should be considered on track to be college-ready.
For AP exams, the reports display the student's probability of scoring at least a 3 or higher, 4 or higher, or 5. For ACT, PSAT, and SAT, the reports display the student's probability of reaching meaningful benchmark scores for each subject.
ACCESS for ELLs Interpretive Guide for Score Reports provides information about these assessments. It includes additional details about the proficiency levels by subject. ACCESS for ELLs reports do not include state percentiles in tables or graphs.
Understanding the Graph
The data in the graph is expressed in state or reference group percentiles.
The red circles represent the student's performance on prior assessments in the selected subject. You'll want to keep in mind that even though the report displays the student's prior scores in only the selected subject, the student's prior scores across tested subjects are used to generate the projection.
The yellow square represents the student's projected score. This point indicates how the student is likely to perform on the selected assessment if the student makes average growth in this subject.
The colored hash marks represent meaningful scores on the selected assessment.
For state assessments, these lines mark the minimum score for each of the state's performance levels. For ACT, PSAT, and SAT, these lines represent meaningful benchmarks. No chart is provided for projections to AP exams.
To see the state or reference group percentile for each mark, place your cursor over the hash mark.
Understanding the Tables
The first table below the chart displays the student's projection data. The cell on the left displays the student's projected state or reference group percentile. This value represents how the student is likely to score relative to the state or reference group distribution if the student makes average growth from now until the next assessment is administered. The projected percentile in this cell of the table is represented by the yellow square in the graph.
The rest of the cells in the table list the student's probability of reaching each assessment milestone noted. For state assessments, these cells indicate the student's likelihood of reaching at least Basic, Proficient, or Advanced on the selected assessment. For AP exams, the cells indicate the student's likelihood of scoring at least a 3 or higher, 4 or higher, or 5. For ACT, PSAT, and SAT, the cells indicate the student's likelihood of reaching meaningful benchmark scores.
The second table lists the student's testing history in the selected subject. In the State NCE\Score column, prior scores for assessments analyzed with the growth standard methodology are listed as reference group NCEs. In the Scale Score column prior scores for assessments analyzed with the predictive methodology are listed as state or reference group scale scores. In the %-ile column, scores for all assessments are listed as state or reference group percentiles.
More Information
What Educators Should Know about Student Projection Probabilities