- Using PVAAS for a Purpose
- Key Concepts
- PEERS
- About PEERS
- Understanding the PEERS pages
- Evaluation List
- Evaluation Summary
- Evaluation Forms
- Add Educator
- Add Evaluator
- Manage Access
- Add a school-level Educator to PEERS
- Add a district-level Educator to PEERS
- Add the Evaluator permission to a user's account
- Remove the Evaluator permission from a district user's account
- Add the Evaluator or Administrative Evaluator permission to a district user's account
- Remove the Administrative Evaluator permission from a district user's account
- Remove an Educator from PEERS
- Restore a removed Educator
- Assign an Educator to a district-level Evaluator
- Assign an Educator to an Evaluator
- Unassign an Educator from an Evaluator
- Assign an Educator to a school
- Unassign an Educator from a school
- Link a PVAAS account to an Educator
- Working with Evaluations
- Switch between Educator and Evaluator
- View an evaluation
- Use filters to display only certain evaluations
- Print the Summary section of an evaluation
- Understanding evaluation statuses
- Determine whether other evaluators have access to an evaluation
- Lock or unlock an evaluation
- Save your changes
- Mark an evaluation as Ready for Conference
- Release one or more evaluations
- Download data from released evaluations to XLSX
- Make changes to an evaluation marked Ready for Conference
- Reports
- School Reports
- LEA/District Reports
- Teacher Reports
- Comparison Reports
- Human Capital Retention Dashboard
- Roster Verification (RV)
- Getting Started
- All Actions by Role
- All Actions for Teachers
- All Actions for School Administrators or Roster Approvers
- Manage teachers' access to RV
- Assign other school users the Roster Approver permission
- View a teacher's rosters
- Take control of a teacher's rosters
- Add and remove rosters for a teacher
- Copy a roster
- Apply a percentage of instructional time to every student on a roster
- Batch print overclaimed and underclaimed students
- Remove students from a roster
- Add a student to a roster
- Return a teacher's rosters to the teacher
- Approve a teacher's rosters
- Submit your school's rosters to the district
- All Actions for district admin or district roster approvers
- Assign other LEA/district users the Roster Approver permission
- Take control of a school's rosters
- View a teacher's rosters
- View the history of a teacher's rosters
- Edit a teacher's rosters
- Add and remove rosters for a teacher
- Copy a roster
- Apply a percentage of instructional time to every student on a roster
- Batch print overclaimed and underclaimed students
- Return a school's rosters to the school
- Approve rosters that you have verified
- Submit your district's rosters
- Understanding the RV Pages
- Viewing the History of Actions on Rosters
- Additional Resources
- Admin Help
- General Help
Decision Dashboard
Understanding the Report
The data in the Decision Dashboard is presented in two sections. The top section displays the value-added data as color-coded blocks. For each grade and subject or Keystone content area, the report displays the growth measure color for the most recent year and for the three-year average, when available. If no three-year average is available, then the block is white. |
|
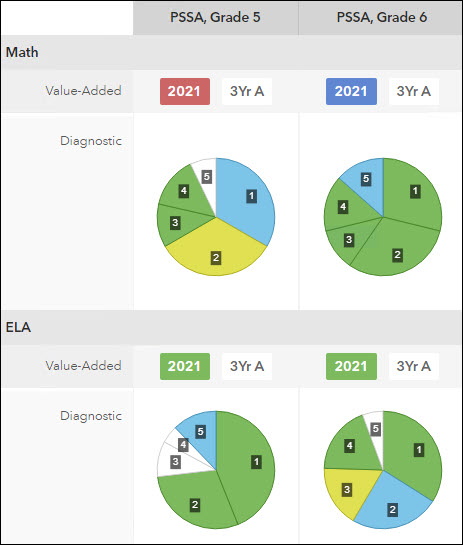
The quintile diagnostic data appears in color-coded pie charts. The size of each slice in a pie represents the percentage of students in the School who were in each quintile diagnostic achievement group for that grade and subject or Keystone content area. The colors match the colors used on the pie charts in the School quintile diagnostic report.
The bottom section is a table that displays the same information with color-coded symbols. You'll find a legend of the symbols below the table.
Highlighting
When you first view the report, highlighting is On by default. When you roll your cursor over either section, corresponding items are highlighted in both sections. For example, if you roll the cursor over the pie slice for Achievement Group 3 for a particular grade and subject or Keystone content area, the Decision Dashboard will highlight the Achievement Group 3 pie slice for all grades, subjects, and Keystone content areas and the Achievement Group 3 column in the table.
To turn highlighting off, click the Off button between the top and bottom sections. Pie chart animation is then limited to the selected pie chart, and highlighting is turned off for all other pies and for the table.
Grouping by Grade or Subject
When you first view the report, the data is displayed with each grade in a different column and each subject in a different row. Keystone content areas are displayed in the far-right column.
This grouping can be changed so that grades are displayed in columns and subjects in rows. When the data is grouped this way, Keystone content areas are displayed in the last column. To group the data this way, select Subject from the Group By menu.
Managing the Top Section
Restricting the Displayed Reports
By default, the top section displays data from both the value-added and quintile diagnostic reports. To display only the value-added data or only the quintile diagnostic data, choose from the Show Reports menu between the sections.
Restricting the Displayed Grades and Subjects
To remove a subject or grade from the graphs, click the X in the left column of the table next to the grade or subject you want to remove. That grade or subject will no longer be displayed in the top section of the report.
Click Remove All at the top of the bottom table to remove all grades and subjects from the top section. Click Add All to restore the display to once again include all grades and subjects.