- Using PVAAS for a Purpose
- Key Concepts
- PEERS
- About PEERS
- Understanding the PEERS pages
- Evaluation List
- Evaluation Summary
- Evaluation Forms
- Add Educator
- Add Evaluator
- Manage Access
- Add a school-level Educator to PEERS
- Add a district-level Educator to PEERS
- Add the Evaluator permission to a user's account
- Remove the Evaluator permission from a district user's account
- Add the Evaluator or Administrative Evaluator permission to a district user's account
- Remove the Administrative Evaluator permission from a district user's account
- Remove an Educator from PEERS
- Restore a removed Educator
- Assign an Educator to a district-level Evaluator
- Assign an Educator to an Evaluator
- Unassign an Educator from an Evaluator
- Assign an Educator to a school
- Unassign an Educator from a school
- Link a PVAAS account to an Educator
- Working with Evaluations
- Switch between Educator and Evaluator
- View an evaluation
- Use filters to display only certain evaluations
- Print the Summary section of an evaluation
- Understanding evaluation statuses
- Determine whether other evaluators have access to an evaluation
- Lock or unlock an evaluation
- Save your changes
- Mark an evaluation as Ready for Conference
- Release one or more evaluations
- Download data from released evaluations to XLSX
- Make changes to an evaluation marked Ready for Conference
- Reports
- School Reports
- LEA/District Reports
- Teacher Reports
- Comparison Reports
- Human Capital Retention Dashboard
- Roster Verification (RV)
- Getting Started
- All Actions by Role
- All Actions for Teachers
- All Actions for School Administrators or Roster Approvers
- Manage teachers' access to RV
- Assign other school users the Roster Approver permission
- View a teacher's rosters
- Take control of a teacher's rosters
- Add and remove rosters for a teacher
- Copy a roster
- Apply a percentage of instructional time to every student on a roster
- Batch print overclaimed and underclaimed students
- Remove students from a roster
- Add a student to a roster
- Return a teacher's rosters to the teacher
- Approve a teacher's rosters
- Submit your school's rosters to the district
- All Actions for district admin or district roster approvers
- Assign other LEA/district users the Roster Approver permission
- Take control of a school's rosters
- View a teacher's rosters
- View the history of a teacher's rosters
- Edit a teacher's rosters
- Add and remove rosters for a teacher
- Copy a roster
- Apply a percentage of instructional time to every student on a roster
- Batch print overclaimed and underclaimed students
- Return a school's rosters to the school
- Approve rosters that you have verified
- Submit your district's rosters
- Understanding the RV Pages
- Viewing the History of Actions on Rosters
- Additional Resources
- Admin Help
- General Help
| School Diagnostic | 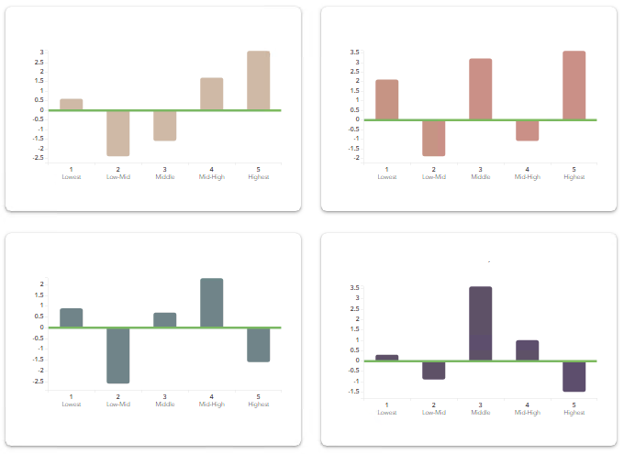 |
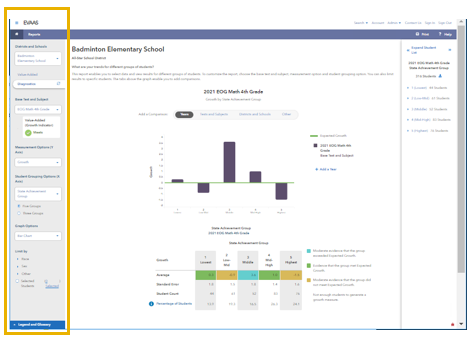
How This Report Helps You
This report enables you to select data and view results for different groups of students. To customize the report, choose a Base Test and Subject, a Measurement Option, and a Student Grouping Option. You can also limit results to specific students. The tabs above the graph enable you to add comparisons.
Use diagnostic reports to assess the growth of students for different grouping options or by student group.
- Examine a variety of metrics or measures and grouping variables. With two ways to select grouping variables, you can make comparisons across different groups.
- Compare the base test and subject to additional years, tests and subjects, LEAs/districts and schools (if your account allows for that), or other custom comparisons of your choice.
- Set priorities for improving the instructional program to meet the needs of students at all achievement levels.
- Use the expanded student list to create a custom diagnostic report.
- Reflect on how your instructional programs are supporting the growth of all students.
Student information is not available when one or more of the following is true:
|
About Diagnostic Reports
Diagnostic reports offer important information about the growth of student groups. The reports provide the ability to compare growth of student groups by achievement group, expected performance level, or other characteristics.
Selecting Data
 | Use the filter panel, on the left side of the report, to select the types of data to display in the chart. Compare years, tests and subjects, or LEAs/districts and schools. View up to four results at a time. Year. The year determines which tests and subjects are displayed. Base Test and Subject. The test and subject that you want to investigate and compare to other tests and subjects. Measurement Options (Y Axis). These are plotted on the vertical axis. For more information see Understanding Measurement Options Student Grouping Options (X Axis). These are plotted on the horizontal axis. For more information see Understanding Student Grouping Options. When you use Limit by, the chart displays only the students with the characteristic that you select. Use Student Grouping Options to compare students with a characteristic to those without it. |
Making Comparisons
| Use options above the chart to add data from other years, tests and subjects, LEAs/districts and schools, and more. Your options might be limited to the data that you have access to. After you add comparison data, the option to compare data separately appears. For example, if you add one or more years, the option to Compare Years Separately appears. You can view up to four results at a time on separate graphs. |

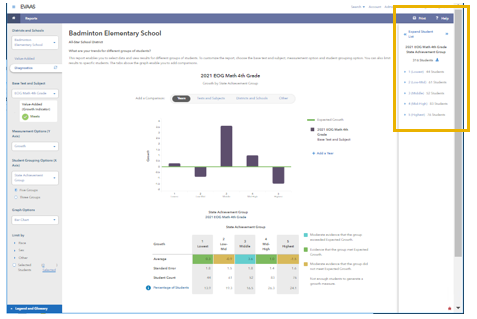
Viewing, Selecting, and Downloading Student Data
| Users with access to student reports can view data for individual students and click Expand Student List to view more data and select specific students for custom graphs. Click Expand Student List to view more data for all students. If you cannot see the student list, contact your PVAAS admin about your account permissions. Access to student data is controlled by local policies. In the expanded student list, you can:
|
Differences in student counts within each year can cause slight shifts in the NCEs for prior years. For more information see Why Students' NCEs Might Change.
More Information
Diagnostic and Projection Summary Reports: Using Together for Decision Making