- Using PVAAS for a Purpose
- Key Concepts
- PEERS
- About PEERS
- Understanding the PEERS pages
- Evaluation List
- Evaluation Summary
- Evaluation Forms
- Add Educator
- Add Evaluator
- Manage Access
- Add a school-level Educator to PEERS
- Add a district-level Educator to PEERS
- Add the Evaluator permission to a user's account
- Remove the Evaluator permission from a district user's account
- Add the Evaluator or Administrative Evaluator permission to a district user's account
- Remove the Administrative Evaluator permission from a district user's account
- Remove an Educator from PEERS
- Restore a removed Educator
- Assign an Educator to a district-level Evaluator
- Assign an Educator to an Evaluator
- Unassign an Educator from an Evaluator
- Assign an Educator to a school
- Unassign an Educator from a school
- Link a PVAAS account to an Educator
- Working with Evaluations
- Switch between Educator and Evaluator
- View an evaluation
- Use filters to display only certain evaluations
- Print the Summary section of an evaluation
- Understanding evaluation statuses
- Determine whether other evaluators have access to an evaluation
- Lock or unlock an evaluation
- Save your changes
- Mark an evaluation as Ready for Conference
- Release one or more evaluations
- Download data from released evaluations to XLSX
- Make changes to an evaluation marked Ready for Conference
- Reports
- School Reports
- LEA/District Reports
- Teacher Reports
- Comparison Reports
- Human Capital Retention Dashboard
- Roster Verification (RV)
- Getting Started
- All Actions by Role
- All Actions for Teachers
- All Actions for School Administrators or Roster Approvers
- Manage teachers' access to RV
- Assign other school users the Roster Approver permission
- View a teacher's rosters
- Take control of a teacher's rosters
- Add and remove rosters for a teacher
- Copy a roster
- Apply a percentage of instructional time to every student on a roster
- Batch print overclaimed and underclaimed students
- Remove students from a roster
- Add a student to a roster
- Return a teacher's rosters to the teacher
- Approve a teacher's rosters
- Submit your school's rosters to the district
- All Actions for district admin or district roster approvers
- Assign other LEA/district users the Roster Approver permission
- Take control of a school's rosters
- View a teacher's rosters
- View the history of a teacher's rosters
- Edit a teacher's rosters
- Add and remove rosters for a teacher
- Copy a roster
- Apply a percentage of instructional time to every student on a roster
- Batch print overclaimed and underclaimed students
- Return a school's rosters to the school
- Approve rosters that you have verified
- Submit your district's rosters
- Understanding the RV Pages
- Viewing the History of Actions on Rosters
- Additional Resources
- Admin Help
- General Help
| School Projection Summary | 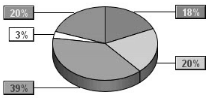 |
Interpreting the Data
This report summarizes students' probabilities of success on future assessments. Combined with other data, this report is useful as an indicator for comprehensive planning, intervention and enrichment planning, and resource allocation.
It's important to consider the relative size of each probability category on your reports. This information is helpful in setting priorities for the current school year.
If most of your students have at least a 70% probability of reaching the Proficient range, you might want to focus on:
- Maintaining students at that performance level
- Providing enrichment opportunities to move students to the Advanced range
- Providing targeted interventions for the students in lower probability ranges (Tiers 2 and 3 in an RtII framework)
If your report does not show a clear majority of students with either a high or low probability of reaching the Proficient range, you might want to analyze your data more closely and set both short-term and long-term improvement goals at Tiers 1, 2, and 3 in an RtII or MTSS framework.
When used alongside other information, the projection data offers useful indicators for:
- Placing students into courses
- Placing students with teachers
- Identifying students who need a sustained intervention
- Identifying students who would benefit from enrichment opportunities
- Planning for differentiated instruction in the classroom
- Planning for students' college readiness
More Information
What Educators Should Know about PVAAS Student Probabilities
Diagnostic and Projection Summary Reports: Using Together for Decision Making